Frequently Asked Senior Interview Questions
Prepare for advanced JVM and memory design questions often asked in senior Java interviews.
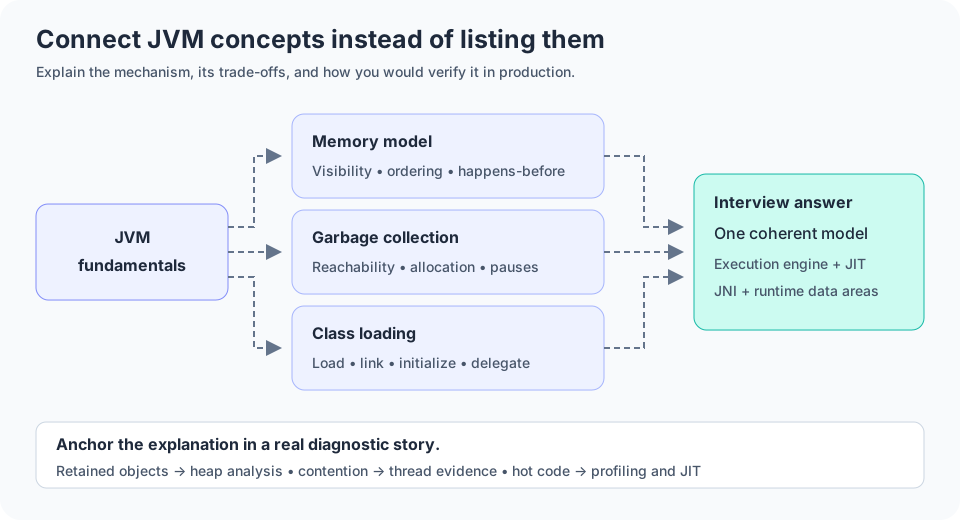
Explain the complete JVM architecture.
A strong answer explains class loading, runtime data areas, execution engine, GC, JMM, and JNI interactions in one coherent model.
The interviewer wants to see both breadth and how the pieces work together.
What happens when a Java program starts?
A Java program starts by launching the JVM, loading bootstrap classes, initializing the runtime environment, and preparing the main thread.
The program then loads application classes, resolves dependencies, and begins execution from the main method.
Explain the class loading mechanism.
The JVM loads, links, and initializes classes lazily, using the class loader hierarchy and parent delegation model.
This ensures correct class resolution while keeping the runtime organized and secure.
Explain the Java Memory Model.
The JMM defines visibility, ordering, and happens-before guarantees among threads. These guarantees are essential for correct concurrency design.
A senior answer explains how synchronized, volatile, and final provide these guarantees.
Explain the object creation process.
Objects are created by allocating memory, running constructors, initializing fields, and publishing the reference to program code.
The JVM also ensures object state is valid before the reference becomes externally visible.
Explain HashMap internals.
HashMap uses buckets, hashing, collision handling, and resizing to store key-value pairs efficiently.
The internals are often discussed alongside array resizing and load factor behavior.
Explain ConcurrentHashMap internals.
ConcurrentHashMap uses segmented or bucket-level locking and CAS-based updates to provide thread-safe access with high concurrency.
The answer should mention its design for scalability and non-blocking reads.
Explain the G1 GC algorithm.
G1 partitions the heap into regions, tracks garbage density, and collects the regions with the most reclaimable memory first.
It balances throughput and latency using concurrent phases and targeted pause behavior.
Explain JIT compiler optimizations.
The JIT compiler optimizes hot code using inlining, escape analysis, loop transformations, dead code elimination, and specialization.
Senior explanations mention profiling and adaptation to runtime behavior.
Explain escape analysis.
Escape analysis determines whether objects can be treated as local to a method and therefore stack-allocated or eliminated from synchronization.
This is a classic JVM optimization that affects allocation and lock behavior.
Explain memory leaks in Java.
Memory leaks in Java happen when objects remain strongly reachable longer than intended, preventing GC from reclaiming them.
A senior answer discusses retained references, classloader leaks, and heap analysis.
Explain thread synchronization internals.
Synchronization relies on monitor locks, object headers, and JVM-managed blocks to ensure mutual exclusion and visibility.
A good answer explains the relationship between lock acquisition and memory ordering.
Explain CAS and its advantages.
CAS performs atomic compare-and-set operations, enabling lock-free concurrency for many shared mutable values.
Its advantages include reduced lock contention, but it requires careful handling of retry loops and memory ordering.
How would you troubleshoot an OutOfMemoryError?
A strong answer starts with heap dumps, GC logs, thread dumps, and heap analysis to identify retained objects and root causes.
It also checks the object types, GC configuration, and whether the workload is reasonable for the configured memory.
How do you analyze a heap dump?
Heap dump analysis identifies the largest retained objects and the dominator tree that explains why memory remains alive.
This often uncovers leaks, overly large caches, or unexpected object retention.
How do you tune JVM performance?
A strong answer balances heap sizing, GC choice, CPU profiling, thread tuning, and runtime diagnostics such as JFR and GC logs.
It starts with evidence from metrics and then tunes based on bottleneck analysis rather than guesswork.