Memory Management
Explore heap, stack, TLAB, direct, off-heap, and native memory, plus pools and leaks.
Heap Allocation
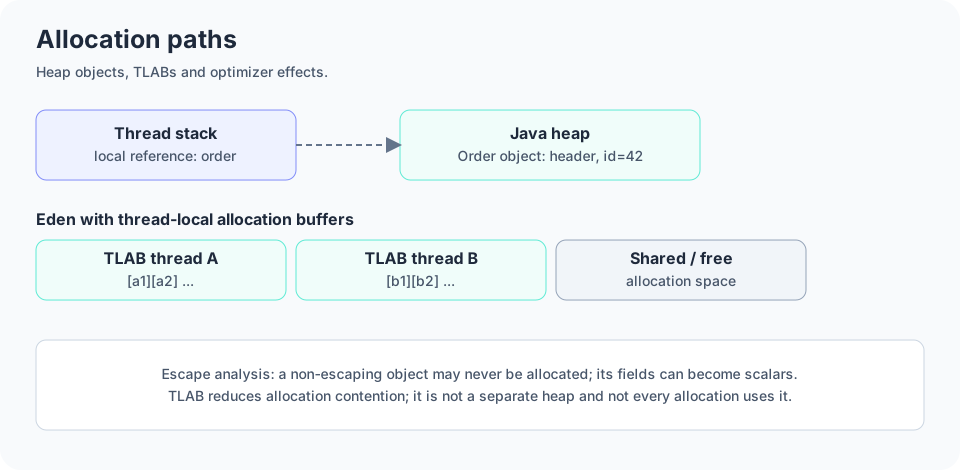
Ordinary objects and arrays are logically allocated from the JVM heap. HotSpot frequently uses fast allocation paths such as thread-local buffers, and optimizers may remove allocations or replace objects with scalar values when that preserves Java semantics.
The Order instance below is logically a heap object and order is a local reference. Neither the exact machine-level location nor the allocation instruction is guaranteed by the language.
class Order {
    int id;
    Order(int id) { this.id = id; }
}

Order order = new Order(42);Stack Allocation
Each Java thread has a stack of frames for method execution: local variable slots, operand-stack state, and return bookkeeping. Stack allocation of whole Java objects is not a general language guarantee; the JIT can eliminate or scalar-replace non-escaping objects in optimized code.
The locals below belong to method execution state. A new Point(...) is an object in Java's semantics, but optimization may avoid allocating it if it does not escape.
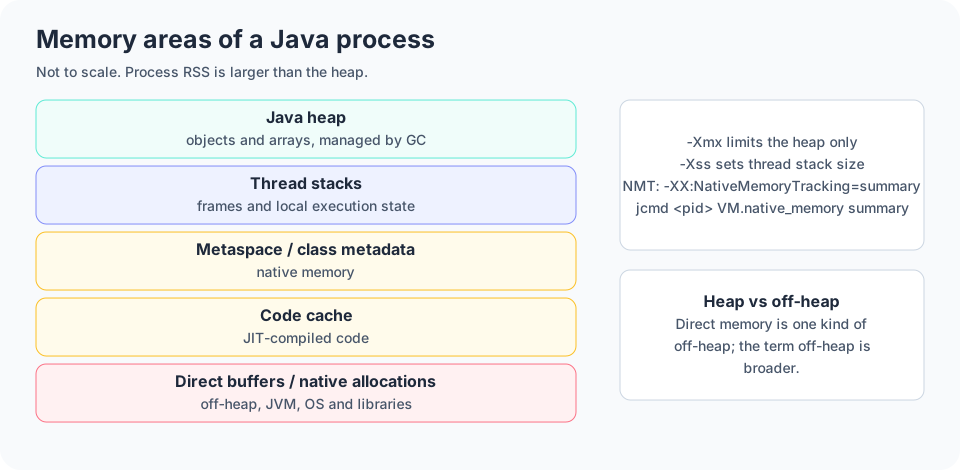
-Xss configures thread stack size on common HotSpot builds, and a too-small stack can cause StackOverflowError. Do not confuse heap and stack.
static int compute() {
    int x = 10;
    int y = 20;
    return x + y;
}TLAB (Thread Local Allocation Buffer)
A TLAB is a small slice of the Eden allocation area reserved for fast allocations by one thread. It reduces contention when multiple threads allocate.
The JVM may allocate eligible objects in each thread's TLAB; compiler optimizations and buffer sizing affect behavior. A TLAB is not a separate heap and not every allocation uses it.
Runnable allocate = () -> {
    for (int i = 0; i < 100_000; i++) {
        Object obj = new Object();
        java.lang.ref.Reference.reachabilityFence(obj);
    }
};

new Thread(allocate).start();
new Thread(allocate).start();Direct Memory
Direct buffers are byte buffers whose content can reside outside the Java heap. They are useful for I/O because native operations may access direct storage without copying through a heap array in some scenarios.
The ByteBuffer wrapper is still a Java object; the underlying storage is not ordinary heap-array storage. Consumption may be constrained with -XX:MaxDirectMemorySize (semantics depend on build). Avoid keeping direct buffers alive unnecessarily, because release is not immediate when they lose reachability.
import java.nio.ByteBuffer;

ByteBuffer buffer = ByteBuffer.allocateDirect(1024);
buffer.putInt(123);
buffer.flip();
System.out.println(buffer.getInt());Off-Heap Memory
Off-heap is a general term for memory outside the Java object heap. Direct buffers, native libraries, memory-mapped files, and foreign-memory APIs can all involve off-heap storage, so the term is broader than direct memory.
The Arena in the Foreign Function & Memory API gives explicit lifetime management for native segments. It is standard from JDK 22, so use the API matching your JDK. Off-heap memory is not automatically safe from leaks.
import java.lang.foreign.Arena;
import java.lang.foreign.MemorySegment;
import java.lang.foreign.ValueLayout;

try (Arena arena = Arena.ofConfined()) {
    MemorySegment segment = arena.allocate(1024);
    segment.set(ValueLayout.JAVA_INT, 0, 99);
    System.out.println(segment.get(ValueLayout.JAVA_INT, 0));
}Native Memory
Native memory is process memory used outside the managed Java object heap: thread stacks, class metadata, code cache, internal JVM structures, direct-buffer backing storage, and native-library allocations.
Native Memory Tracking is HotSpot-specific, adds overhead, and does not necessarily include every third-party native allocation. Also inspect process RSS and container memory, because -Xmx does not cap total process memory.
java -XX:NativeMemoryTracking=summary -jar application.jar
jcmd <pid> VM.native_memory summaryMemory Pools
A memory pool is a managed memory area reported or organized by the runtime. Java exposes pool information through management APIs, but pool names depend on collector and JVM version, for example G1 Eden Space, G1 Survivor Space, G1 Old Gen, Metaspace, and CodeHeap segments.
A reported pool is a management abstraction, not a separate physical RAM region or fixed heap subdivision. Use the actual pool names from your JVM rather than assuming an old-generation pool always exists.
import java.lang.management.ManagementFactory;
import java.lang.management.MemoryPoolMXBean;

public class MemoryPoolsDemo {
    public static void main(String[] args) {
        for (MemoryPoolMXBean pool :
                ManagementFactory.getMemoryPoolMXBeans()) {
            System.out.println(pool.getName() + " -> " + pool.getUsage());
        }
    }
}Memory Leaks
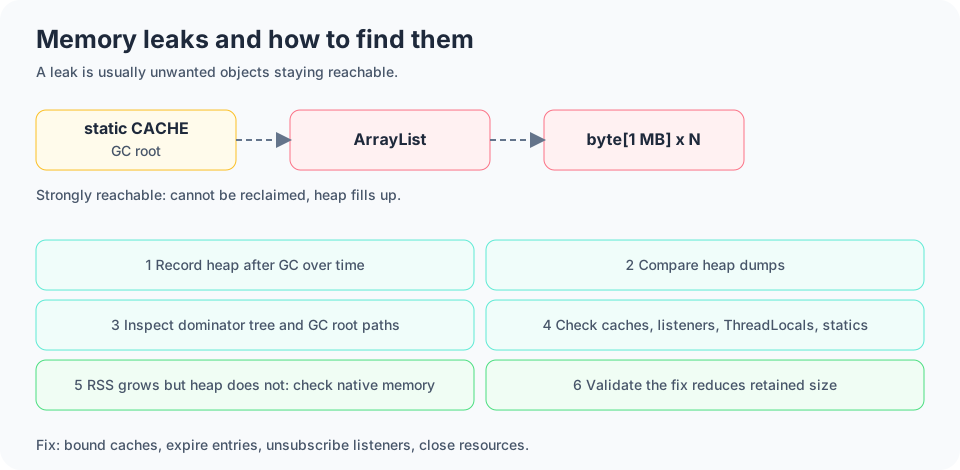
A Java memory leak often occurs when the application keeps objects reachable after they are no longer useful. Leaks can also occur outside the heap when native resources are not released.
In the unbounded static cache below, the arrays stay strongly reachable through CACHE and can exhaust the heap. This is intentionally unsafe demo code; do not run it without a controlled heap limit.
Fix it by bounding the cache by entries or bytes, removing expired items, using a well-designed cache library, unsubscribing listeners, closing resources, and not retaining request-scoped objects in static fields.
- Record heap occupancy after GC over time.
- Compare heap dumps from multiple points in time.
- Inspect the dominator tree and paths to GC roots.
- Check cache sizes, listeners, ThreadLocal values, and static collections.
- If process RSS grows but the heap does not, investigate native and off-heap usage.
- Validate that the fix reduces retained size in repeated tests.
import java.util.ArrayList;
import java.util.List;

public class LeakingCache {
    private static final List<byte[]> CACHE = new ArrayList<>();

    public static void main(String[] args) {
        while (true) {
            CACHE.add(new byte[1024 * 1024]);
        }
    }
}Heap vs Stack vs Direct vs Native Memory
Eligibility for heap GC and timely release of native storage are different concerns. In the example below, assigning null to either variable removes one reference but forces no immediate reclamation, and the direct buffer contents may occupy native memory.
| Area | Typical content | Lifetime / manager |
|---|---|---|
| Heap | Java objects and arrays | GC + JVM runtime |
| Thread stack | Frames / local execution state | Thread / runtime |
| Direct memory | NIO direct-buffer backing | Buffer / native mechanisms |
| Native memory | JVM and native allocations | JVM, OS, libraries, APIs |
| Off-heap | Umbrella term outside heap | Depends on allocation API |
import java.nio.ByteBuffer;

public class MemoryLifecycleDemo {
    static class Record {
        int id;
        Record(int id) { this.id = id; }
    }

    public static void main(String[] args) {
        Record record = new Record(7);                 // heap object
        ByteBuffer direct = ByteBuffer.allocateDirect(256);
        direct.putInt(record.id);                      // off-heap backing storage
        direct.flip();
        System.out.println(direct.getInt());           // 7

        record = null;  // removes one strong reference
        direct = null;  // removes one buffer reference
    }
}Quick Revision and Interview Questions
Parallel versus concurrent GC? Parallel uses multiple collector workers; concurrent overlaps GC work with application threads. A GC can use both.
Why was CMS removed? Fragmentation and maintenance challenges, superseded by newer collectors; removed in JDK 14.
Why can G1 collect selected regions? Region liveness predictions and remembered sets help it choose and process collection sets.
What is a card table? Coarse metadata marking memory areas with changed references to support targeted scanning.
Write versus read barriers? Write barriers run around reference updates; read/load barriers run around reference loads. Usage differs by algorithm.
How does SATB work? It records overwritten references to approximate an initial object-graph snapshot during concurrent marking.
Is a 100 ms G1 pause target guaranteed? No, it is a goal subject to workload and collector conditions.
Is every Java object physically heap allocated? Java specifies object semantics; the JIT can eliminate or scalar-replace non-escaping allocations.
Does -Xmx limit total process RSS? No; stacks, metaspace, code cache, and direct buffers are outside the heap limit.
Why can Java leak memory even with GC? Unwanted objects stay strongly reachable, and native allocations can remain unreleased.
Are ZGC and Generational ZGC two choices on JDK 26? No; ZGC is generational from JDK 24 and non-generational mode was removed.
How do you inspect memory use? Combine GC logs, MemoryPoolMXBeans, heap dumps, allocation profiles, NMT, and process or container metrics.