Common Production Issues
Learn the most common JVM problems and how they manifest in real systems.
OutOfMemoryError
OutOfMemoryError indicates that the JVM could not allocate enough heap or native memory for the workload.
It often points to memory leaks, poor tuning, or traffic spikes that exceed expected capacity.
StackOverflowError
StackOverflowError happens when a thread exhausts its stack due to deep recursion or excessive method nesting.
This is a sign that call depth or recursion is not bounded correctly.
GC Overhead Limit Exceeded
This error occurs when the JVM spends too much time in GC relative to actual work and cannot progress efficiently.
It is often a sign of severe memory pressure or an ineffective GC configuration.
Metaspace OutOfMemoryError
Metaspace OOM happens when the JVM runs out of native memory for class metadata.
This commonly appears in environments with dynamic class generation or classloader leaks.
Direct Buffer Memory Error
Direct buffer memory error often occurs when Java uses off-heap buffers without enough native memory.
It usually indicates either too many buffers or insufficient OS/native memory headroom.
Memory Leak Detection
Memory leak detection involves finding objects that remain referenced even after they should no longer be active.
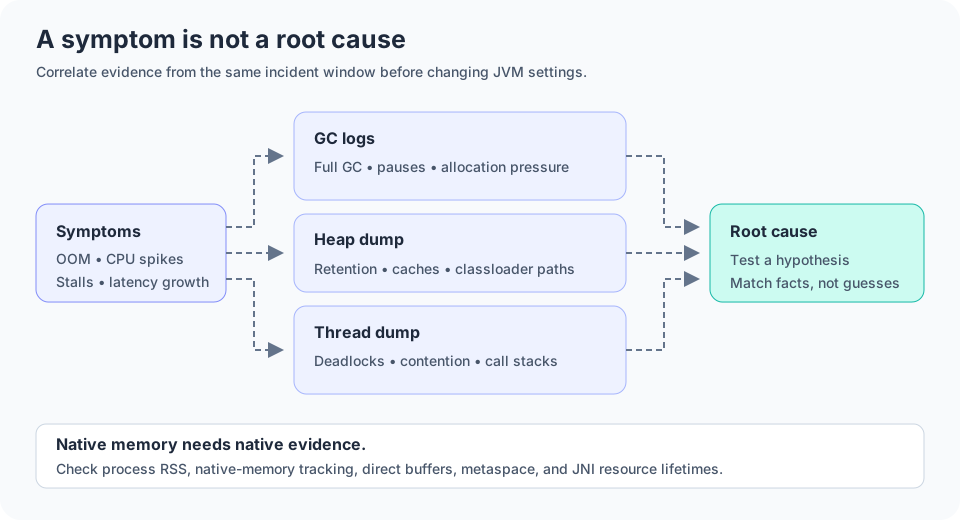
Tools such as heap dumps, retained set analysis, and GC logs are essential here.
High CPU Usage
High CPU usage may stem from inefficient algorithms, hot loops, excessive lock contention, or runaway GC cycles.
A CPU profile helps identify the exact thread or method consuming the time.
Frequent Full GC
Frequent full GC indicates the heap cannot reclaim enough memory quickly enough across generations.
This often signals old-generation pressure, fragmentation, or bad object retention.
Thread Deadlocks
Deadlocks happen when threads wait on each other in a cycle and no progress can be made.
Thread dumps and lock analysis are the standard tools for diagnosing these cases.
Thread Contention
Thread contention occurs when multiple threads compete for the same lock or shared resource.
This often reduces throughput and can create bottlenecks in memory or I/O bound systems.
Native Memory Leak
Native memory leaks happen outside the Java heap, often in direct buffers, JNI code, or unsupported native libraries.
These are harder to diagnose because ordinary heap analysis may not reveal the root problem.
ClassLoader Leak
ClassLoader leaks keep classes and their metadata alive longer than expected, often causing metaspace pressure.
They are common in frameworks, app servers, and long-running applications.