Execution Engine
Understand interpretation, HotSpot tiered compilation, profiling, the native code cache, hot methods and loops, and correctness-preserving deoptimization.
Interpreter
The execution engine executes the bytecode produced by javac. Its interpreter can begin executing bytecode instructions without first optimizing an entire method into native machine code, making it useful for startup and cold code.
For int sum = a + b, the bytecode describes loading operands, adding, and storing the result. Interpretation performs the operations described by those instructions each time the code executes. Calling this translation instruction by instruction is a teaching simplification; an interpreter is itself native code implementing bytecode semantics.
The trade-off is repeated interpretation overhead. Paying a large optimizing-compilation cost for every rarely used method would also be wasteful, so interpretation remains valuable even in a JIT-enabled runtime.
Just-In-Time (JIT) Compiler
The JIT compiles selected bytecode into native machine code while the program is running. Subsequent executions can reuse compiled code rather than repeatedly interpreting the same instructions.
The source's million-iteration sum loop illustrates why frequently executed code is worth compiling. Compilation itself consumes CPU and memory; a hot loop is a candidate, not a promise that a particular iteration count always triggers a particular compiler.
Runtime information can enable optimizations unavailable from source alone, including specialization for observed receiver types and branch behavior. Those optimizations must still preserve Java semantics.
long sum = 0;
for (int i = 0; i < 1_000_000; i++) {
    sum += i;
}
System.out.println(sum); // 499999500000
// A hot-loop candidate, not a guaranteed compilation threshold.HotSpot JVM and Adaptive Optimization
HotSpot is the JVM implementation used by OpenJDK and many distributions, including Oracle JDK. Its name reflects the strategy of finding execution hot spots and spending optimization effort there.
It combines interpretation, runtime profiling, JIT compilation, and adaptive optimization. A method such as calculateSalary() that is invoked repeatedly may justify native compilation, while a one-time initialization path may remain interpreted.
These are HotSpot implementation techniques, not requirements that every conforming JVM use C1, C2, or the same optimization policy. Configuration and workload influence the execution path.
Tiered Compilation: Startup versus Peak Performance
Tiered compilation combines interpretation with fast and more aggressive compilation. C1 generally produces code quickly and can retain profiling instrumentation; C2 spends more effort optimizing code expected to run enough to repay that cost.
The source shows interpreter, C1, more runtime data, and C2 as a conceptual progression. HotSpot does not require every method to visit every level in that order. Queue pressure, profiling maturity, runtime flags, and method characteristics can change the chosen route.
Warmup is therefore real: the code mix, profiles, and compiled versions can evolve during a run. Comparing a first request to a warmed steady-state request can measure different execution regimes.
| Typical HotSpot level | Execution strategy | Purpose |
|---|---|---|
| 0 | Interpreter | Begin execution and gather initial information |
| 1 | C1 without profiling | Quick compiled execution when profiling is not needed |
| 2 | C1 with limited profiling | Compile quickly with selected counters |
| 3 | C1 with fuller profiling | Collect richer data for further optimization |
| 4 | C2 optimized code | Use mature profiles for peak execution performance |
Code Cache
The code cache holds executable native code generated by the JVM, including compiled methods and runtime code. It is distinct from the Java object heap: increasing the heap is not the same as increasing available compiled-code storage.
Caching avoids compilation on every invocation. The source's compile-once/reuse-many-times model explains the benefit, but an individual method can have several compiled versions over time as profiling and optimization decisions change.
Compiled code may become invalid, be superseded, or be reclaimed. Code-cache capacity and compilation activity are runtime concerns; an indefinitely growing cache of every version would not be sustainable.
| Storage | Contains | Not the same as |
|---|---|---|
| Class representation | Bytecode and class/method metadata | A JIT-compiled method body |
| Code cache | Executable generated native code | The Java heap containing domain objects |
| Java heap | Objects and arrays | All memory used by the JVM process |
Profiling and Compilation Decisions
The engine gathers execution information to decide where compilation is worthwhile. Invocation counters and loop back-edge counts identify repeated activity; receiver-type and branch profiles can guide specialization and layout.
The document also lists execution time and memory usage as useful runtime observations. Do not interpret that list as a guarantee that every invocation is timed or every allocation measured by the ordinary JIT profile; diagnostic profilers and compiler instrumentation have different scopes.
A loop that calls calculate() a million times can make both the enclosing loop and calculate() interesting. Inlining may then remove a standalone call in the optimized caller, so source-level method counts do not map one-to-one to final machine-code calls.
- Invocation frequency: is a method executed often enough to justify compilation?
- Loop activity: is an already-running method spending significant time on a back edge?
- Receiver types: can a virtual call be specialized safely?
- Branch behavior: is a path common enough to optimize for?
- Compilation cost: does expected reuse justify additional compiler effort?
Hot Methods
A hot method is invoked frequently. The JVM can schedule it for compilation, install the resulting native entry point, and reuse that code for later calls.
The source's add() sketch is intended to return a + b; its illustrative void declaration is corrected below to int. Frequency alone does not fix the final optimization: a small helper may be inlined into its caller instead of remaining a separate call.
static int add(int a, int b) {
    return a + b;
}

long total = 0;
for (int i = 0; i < 1_000_000; i++) {
    total += add(i, 1);
}
System.out.println(total);Hot Loops and On-Stack Replacement
A method need not be called many times to contain hot code. A single invocation with millions of loop iterations can produce a large loop back-edge count and become an optimization candidate.
The JIT may use loop unrolling, invariant-code motion, constant folding, strength reduction, and dead-code elimination when legal and profitable. These transformations reduce overhead or redundant work rather than changing the result the Java program is entitled to observe.
On-stack replacement can transfer the state of an already executing interpreted loop into compiled code at a supported entry point. It avoids waiting for the method to return or restarting the loop from iteration zero.
long sum = 0;
for (int i = 0; i < 10_000_000; i++) {
    sum += i;
}
System.out.println(sum);
// One invocation can become hot through repeated loop iterations.Deoptimization Preserves Correctness
Optimized code may depend on runtime assumptions. If shape.draw() has only seen Circle receivers, the JIT may generate a guarded specialized path or inline Circle.draw(). A later Rectangle receiver requires correct dispatch, not continued use of an invalid Circle-only assumption.
A guard can take another valid path, or invalidated assumptions can cause deoptimization. The VM can reconstruct interpreter-visible execution state, stop using invalid compiled code, gather new profiles, and compile a new version if appropriate.
Deoptimization is the safety mechanism that allows speculation without changing Java behavior. Not every new receiver necessarily triggers it: generated code may already support the new receiver or have a fallback path.
interface Shape { void draw(); }
class Circle implements Shape {
    public void draw() { System.out.println("circle"); }
}
class Rectangle implements Shape {
    public void draw() { System.out.println("rectangle"); }
}
// If a hot call site previously saw only Circle, a Rectangle must
// still dispatch correctly, via a valid path or deoptimization.Execution Flow and Quick Revision
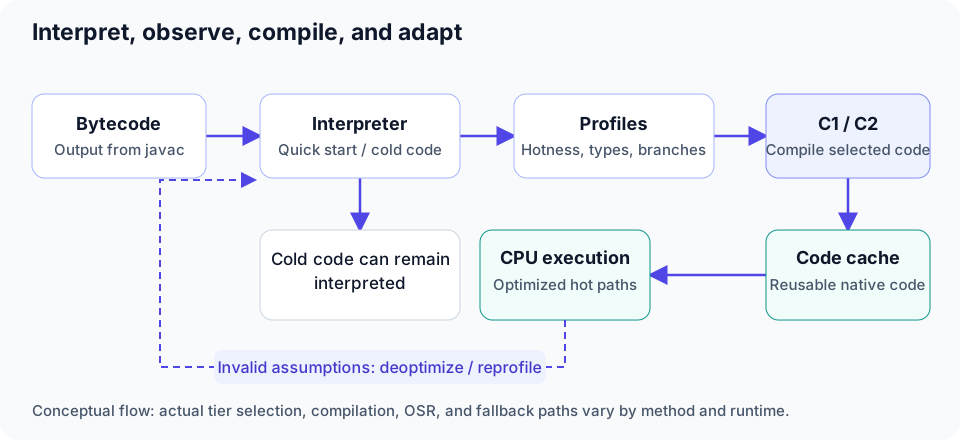
The complete source flow is adaptive: bytecode begins executing, profiling identifies hot methods or loops, compilation produces native code, the code cache enables reuse, and invalid assumptions can send execution back through deoptimization and recompilation.
Interpretation favors getting started; optimized compilation favors repeated execution. A healthy performance analysis distinguishes startup, warmup, compilation cost, code-cache use, and steady-state execution instead of assuming every line is immediately native code.
| Term | Role | Caveat |
|---|---|---|
| Interpreter | Executes bytecode without optimizing compilation first | Useful for cold code as well as startup |
| JIT | Produces reusable native code | Consumes compilation CPU and memory |
| HotSpot | Adapts execution using runtime observations | One JVM implementation, not the Java specification |
| Tiered compilation | Balances fast compilation and deeper optimization | Not every method visits every level |
| Code cache | Stores generated executable code | Native storage, separate from object heap |
| Profiling | Guides hotness and specialization decisions | Different from a full diagnostic profiler |
| Hot loop | Repeated work within a method | Can benefit from OSR during one invocation |
| Deoptimization | Recovers when assumptions are invalid | Preserves semantics while enabling speculation |