Performance Tuning
Tune JVM runtime behavior for throughput, latency, stability, and heap efficiency.
Heap Sizing
Heap sizing controls the amount of memory available to object allocation and GC.
Choosing the correct size helps balance application throughput and memory footprint.
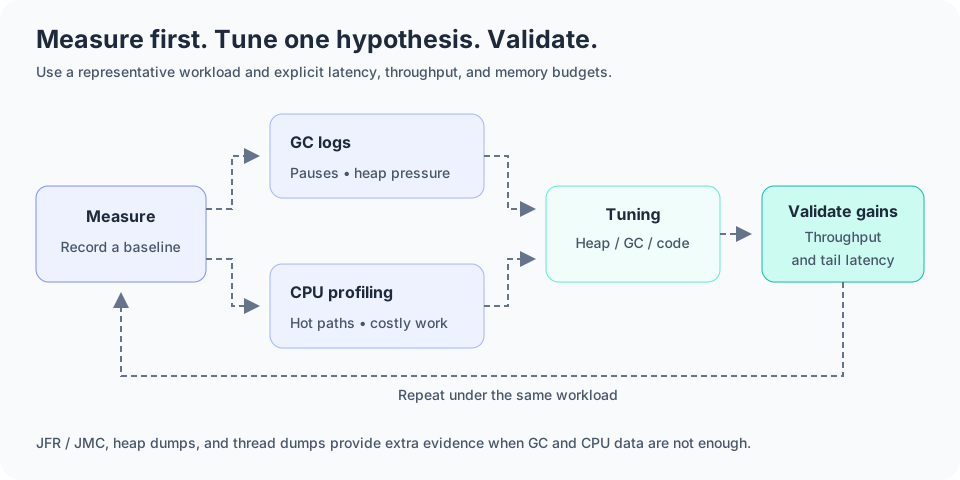
GC Tuning
GC tuning focuses on balancing collection frequency, pause time, and throughput.
This often requires selecting the right collector and adjusting generation sizes and heap ratios.
Metaspace Tuning
Metaspace tuning involves controlling native memory growth and class unloading behavior.
It is essential in environments with dynamic frameworks or frequent code generation.
Thread Stack Tuning
Thread stack size affects recursion depth, stack usage, and memory overhead per thread.
Incorrect tuning can lead to stack overflow or excessive memory consumption in high-concurrency systems.
JVM Startup Options
JVM startup options define everything from heap size and GC selection to logging, classpath, and compiler behavior.
These options materially influence both performance and operational behavior.
GC Logs
GC logs reveal promotion rates, pause times, memory pressure, and young-generation behavior.
They are one of the most valuable sources of runtime evidence during tuning.
Heap Dumps
Heap dumps capture the entire heap state, helping engineers locate large object retention or memory leaks.
They are especially useful when diagnosing OutOfMemoryError conditions.
Thread Dumps
Thread dumps show the call stack and waiting state of each thread at a point in time.
This helps analyze deadlocks, contention, and CPU-heavy code paths.
CPU Profiling
CPU profiling identifies the code paths consuming the most processing time.
It is useful when latency or throughput issues are not obvious from GC logs alone.
Memory Profiling
Memory profiling measures object allocation rates, retention, and churn across application execution.
It helps locate unnecessary allocations and sources of heap pressure.
Flight Recorder (JFR)
JFR continuously collects low-overhead runtime telemetry without heavily impacting the application.
It is often used for deep performance analysis and production diagnostics.
Java Mission Control (JMC)
JMC is a tool for analyzing JFR data and visualizing JVM behaviors such as GC, memory, and CPU usage.
It provides a structured way to investigate performance problems in production.